Before starting you should install:
- Osmose O-Calc® Pro version 5.1 or better
- Microsoft Excel or other product that can edit and display Excel spreadsheet files version 2010 or better (.xlsx).
Overview
O-Calc® Pro 5.1 provides preformatted reports in its Report View. It also provides a link to a Custom Reports tool. The Custom Reports tool combines some information provided by the O-Calc Pro application with a preformatted Excel spreadsheet that has references to the information and then generates a new Excel spreadsheet that is displayed with the result.
Accessing the Custom Reports Tool
If you are using the default layout you will find the Reports tab near the bottom of the application window. On the menu bar of the Reports tab you will find a command labeled Custom Reports.
You will not need to open a report to create or edit a custom report but you will need an open pole to run the report.
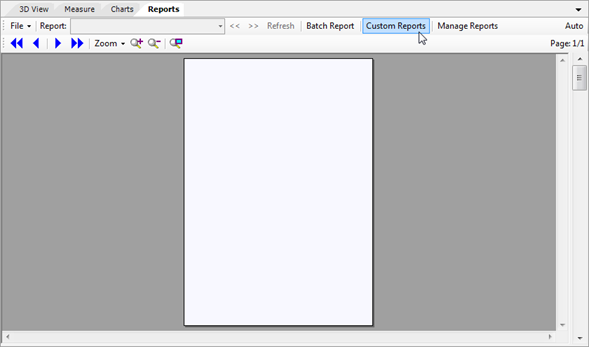
This will open the Custom Reports tool.
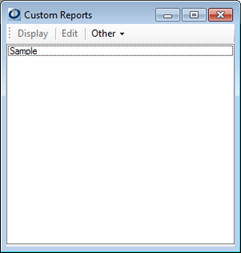
In this example, there is already a report template named “Sample” (file name Sample.xlsx).
The Custom Reports tool provides a menu of functions and a list of available templates.
Functions of the Custom Reports Tool
The Custom Reports tool menu provides the following functions
| Display | Display is inactive (grayed out) until a pole is loaded and a Custom Report template. When you click this command it combines information from the pole with tokens embedded in the template file and creates a new Excel spreadsheet which is displayed by invoking Excel (or whatever application you are using for Excel spreadsheets). |
| Edit | Edit is inactive until a template is selected from the list. When you click this command it invokes the Excel editor product that you have installed opening the selected template for editing. You can make changes and save the template.
You must close the template before clicking the Display command. |
| Other►List Available Tokens | This command creates a plain text file containing a list of tokens that are produced by O-Calc Pro and supported by the Custom Report tool. The plain text file is automatically opened for browsing using Notepad. You can save the file for later reference.
The text includes the Token syntax as well as a brief description for each available token. |
| Other ► Create New Report | This command opens a browser window which allows you to create a blank Excel file. It will not create the file for you. Details follow. |
| Other ► Help | Displays this document |
Creating a New Template File
As indicated, the Other ► Create New Report template command does not directly create an empty template file. It simply opens the Reports folder where Custom Reports templates are found. You need to create an empty Excel file using the file browser. Do this:
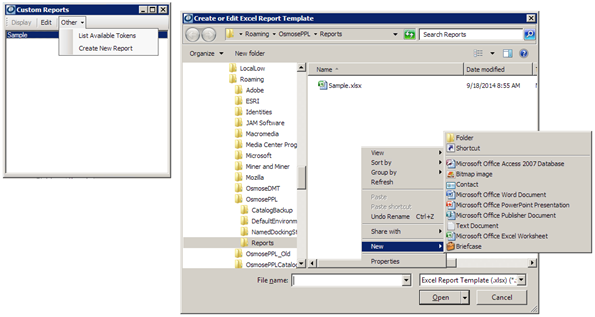
- Click Other ► Create New Report. A browser window will open
- Right click in the file list panel at the right. A context menu will appear.
- Place the cursor over the “New” command and then select Microsoft Office Excel Worksheet from the file type.


-
A new file named “New Microsoft Office Excel Worksheet.xlsx will appear.
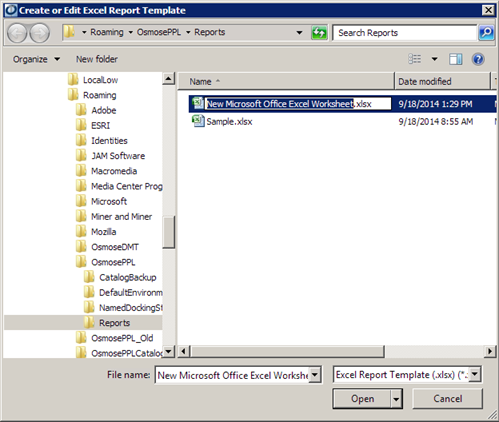
- Rename the file, e.g. Sample2.xlsx
- Now click on the new file (Sample2.xlsx) and click the Open button. It saves the file and opens it with Microsoft Excel. Note that the Excel application window may be hidden behind O-Calc Pro.
This will create the file in the reports folder. The file is a blank Excel spreadsheet that you could have created with Excel. The only advantage to this method is that it creates the blank template in the Reports folder where the Custom Reports tool will look for it.
Note: If you are using another application to create and edit the spreadsheet you may need to create the template using that application. In that case you should save your worksheet template to the “%userprofile%\appdata\roaming\osmoseppl\reports” folder.
Authoring a Report Template
With all tools in place and an understanding of the Custom Reports tool controls we move on to editing an Excel workbook to act as a template for the Custom Reports tool.
The basic operation is to add plain text, O-Calc Pro tokens and some Excel formulas and objects. Like any Excel workbook you place the information in cells where you want it to be displayed.
Tokens
O-Calc Pro will supply data to the final report by replacing each token found in the workbook with its corresponding value.
There are a number of different types of tokens that return values of different types. You can get a list of tokens and their descriptions by clicking Other ► List Available Tokens. An example list is provided in Appendix A.
Browsing the list you find groups of tokens listed as Parameters and Tables.
With the exception of tokens that return a graphic image, all values, numeric or otherwise are returned as text.
Parameters
Parameters represent a single value related to the Pole or Pole model.
Parameter types include:
| Name | Token Prefix | Description |
| Units | %Units_ | Returns text for the specified units. The value of the text will depend on the selected measurement units convention that is selected for the model |
| Software Version | %Software_Version% | Returns the application version in the format MM.mm.rr . |
| Pole | %Pole_ | Various pole attributes including identification, location, file name, etc. |
| Sum | %Sum_ | Summary values for MCU, GLCU, Vertical Buckling Constant, etc. |
| Image | %Image: | Various preformatted graphical views including Side, Top, 3D, Capacity Meter, etc. The tokens can be formatted with pixel width and height. |
| External Image | %ImageFile: | Specifies a means of embedding a path for an external image. |
| Chart | %Chart: | Returns a graphic image for any of the available chart types. Each chart type includes a pixel width and height. |
| Block | %Block: | This inserts a range of cells representing a predefined group of values. |
Tables
Tables contain indexed values related to structures or objects for which there may be multiple instances for the pole.
There are six tables:
| Name | Token Prefix | Description |
| Anchor | %Anchor_ | Attributes of modeled anchors. |
| Strut | %Strut_ | Attributes of modeled struts |
| Guy | %Guy_ | Attributes of modeled guys |
| Load | %Load_ | Attributes of modeled loads |
| Element | %Element_ | Attributes of modeled elements like spans |
| Images | %Images_ | Provides access to all images attached to the model |
Each table has a token <prefix>_row_count% that indicates the number of rows in the corresponding table.
All other table tokens include an index reference. Indexes are 1 based. The first row of the table starts with index value 1. Attributes on the row are named according to the format <prefix><AttributeName><Index>%. As an example if there are four rows in the Anchor table. You can get the Rod Diameter at the Groundline for the 4th anchor in the table by using “%Anchor_RodDiameter_4%”.
A Simple Example
We have already created Sample2.xlsx. If it is not still open then launch the Custom Reports tool, select Sample2.xlsx then click the Edit command on the menu bar.
The file should open in Excel.
This example will display some very simple and basic information about the pole.
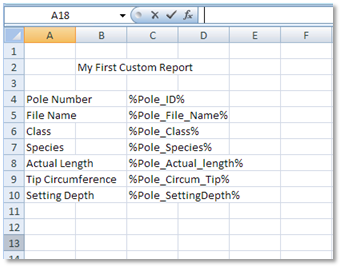
Add a title for the report at the top. Click in cell B2 and type “My First Custom Report”.
Next add some labels for the data you are displaying down the side.
A4 – “Pole Number”
A5 – “File Name”
A6 – “Class”
A7 – “Species”
A8 – “Actual Length”
A9 – “Tip Circumference
A10 – “Setting Depth”
Now, next to each label add the value. We want to keep this simple and make sure that the labels are not truncated. We could change the column width but instead we will just start in column C. Add the tokens for the values to the right of the corresponding label. The token names are case sensitive
The literal part of the token name must be spelled exactly as it appears in the ExcelTokens.txt file. The exception being tokens that include indexes, width height or other variable attributes
C4 – “%Pole_ID%”
C5 – “%Pole_File_Name%”
C6 – “%Pole_Class%”
C7 – “%Pole_Species%”
C8 – “%Pole_Actual_length%”
C9 – “%Pole_Circum_Tip%”
C10 – “%Pole_SettingDepth%”
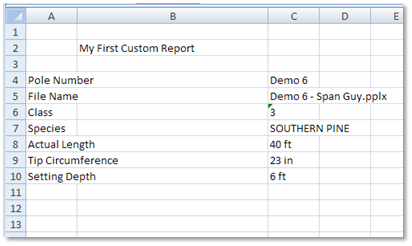
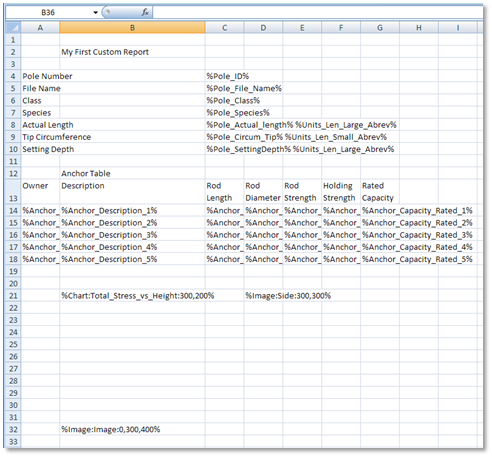
When you get done you should have something that looks like this:
Save the template and close the file.
Now open the pole at C:\ProgramData\Documents\O-Calc Pro\Sample Poles\Demo 6 – Span Guy.pplx.
Go back to the Reports tab and open the Custom Reports tool.
Select Sample2 from the list of custom reports and then click the Display command on the Custom Reports tool menu bar.
Excel will open and you should see something like this:
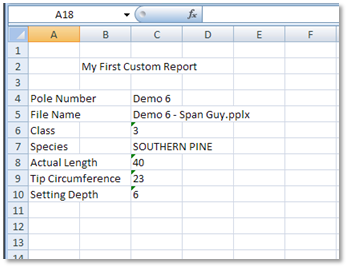
If you do not see this and you find that a literal token name is displayed, then check for a typo in the token name.
For example:
%Pole_Actual_length%
is correct whereas
%Pole_Actual_Length%
is not correct. You will see “%Pole_Actual_Length%” in the value column.
The token names are case sensitive. In this case “length” is correct and “Length” is not.
Building on the Simple Example
The results that appear are fine except one might ask, what are the dimension units for the height, depth and tip circumference?
We can add that information; in fact we will add it to the label text.
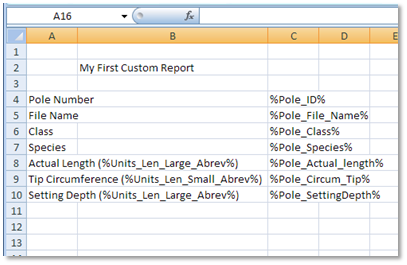
In the Custom Reports tool, select Sample2, click the Edit command and make the following changes:
A8 – “Actual Length (%Units_Len_Large_Abrev%)”
A9 – “Tip Circumference (%Units_Len_Small_Abrev%)”
A10 – “Setting Depth (%Units_Len_Large_Abrev%)”
Sample 2 should now look like this (the C column has been moved to allow the full text to be viewed).
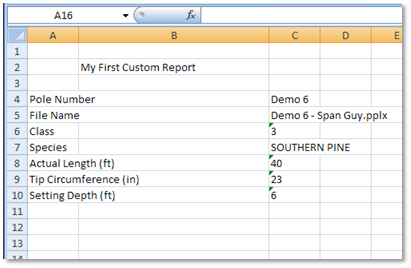
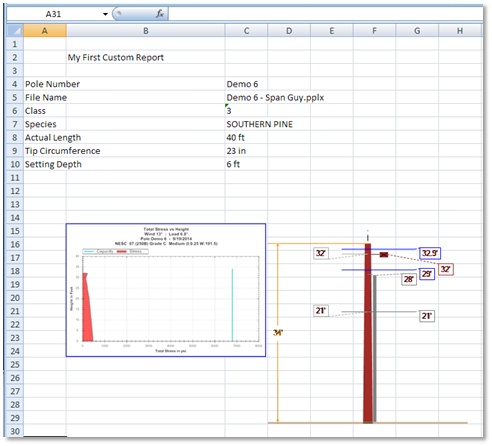
Save the changes and Display again. The new “Demo 6 – Span Guy_Sample2.xlsx”report should look like this:
As an exercise, change Sample2.xlsx so that it produces this:
Adding Images to the Template
O-Calc Pro provides tokens that allow you to add chart and image graphics associated with your pole data. The graphic related tokens indicate an image source and a size in pixels. Add an image by entering a graphic related token in a cell.
When rendered, the graphic will be placed over the cell where the token is placed. Be sure to allow enough room for the graphic to fit without overwriting adjacent cells. There are various ways to avoid this. One way is to merge a range of cells that are large enough to hold the graphic.
The following examples show how to add different types of graphics to the Sample2 template.
Adding a Chart
In this example you will add a Total Stress vs Height chart to the Sample2 report. The chart will be 300 pixels wide and 200 pixels high.
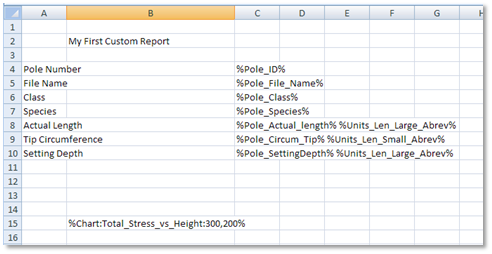
In the Custom Reports tool, select Sample2, click the Edit command and make the following changes:
B15 – ” %Chart:Total_Stress_vs_Height:300,200% ”
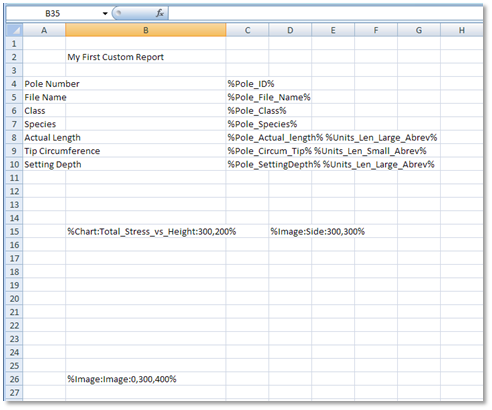
Sample 2 should now look like this:
Save the changes and Display again. The new “Demo 6 – Span Guy_Sample2.xlsx”report should look like this:
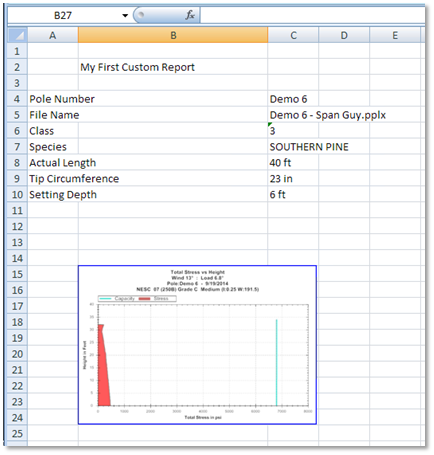
Note that, in this particular case, the chart covers the cell rang B15 to C24. In this case you could modify the Sample2 template to merge this cell range and format it so that the chart is centered in the range.
Adding a Graphic Image
Image tokens work similar to Chart tokens. These tokens allow you to display O-Calc Pro generated graphic images and photographic or external graphic images (e.g. logos).
In our next example you will add a Side view graphic to the right of the chart that you just added. The graphic image will be 300 pixels wide by 300 pixels high.
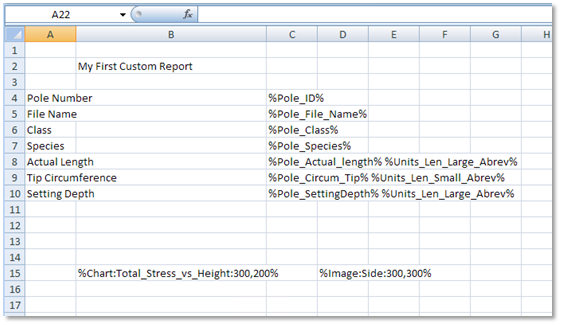
In the Custom Reports tool, select Sample2, click the Edit command and make the following changes:
D15 – “%Image:Side:300,300%”
Sample 2 should now look like this:
Save the changes and Display again. The new “Demo 6 – Span Guy_Sample2.xlsx”report should look like this:
Adding a Photo Image
Photographic images that are included with your pole can be displayed using the %Image:Image: <n>,<w>,<h>% token. Since you can have more than one photograph with the file you select the photograph using the <n> value. The first file attached has a value of 0 for <n>, the second has a value of 1, the third is 2, etc. The <w>,<h> values specify the width and height, respectively, in pixels.
In the Custom Reports tool, select Sample2, click the Edit command and make the following changes:
B31 – “%Image:Image:0,300,400%”
You should adjust the width and height values to match the photo image’s aspect ratio. Photo image properties generally supply the photo width and height. For this example, I added a photo that is 1728 pixels wide by 2304 high to the pole file. I really do not want the image to be displayed wider than 300 pixels so I get the proportional height with the following formula.
display height = display width X (Image height / Image width)
display height = 300 X (2304/1728)
display height = 400
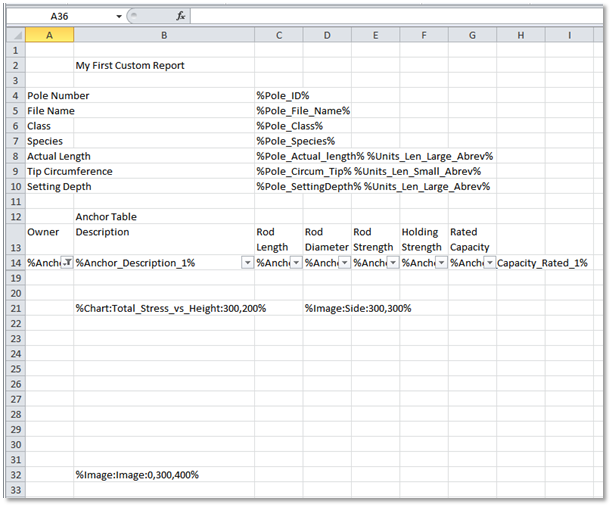
Sample 2 should now look like this:

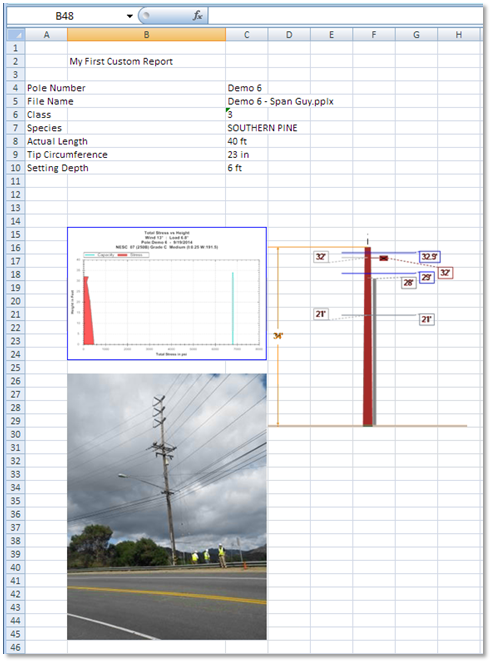
Save the changes and Display again. The new “Demo 6 – Span Guy_Sample2.xlsx”report should look like this:
Adding Table Items to the Template
Table tokens address the table name, item name (column) and index (row). When creating a table in the worksheet you must fill in each cell of the table with the specific item name and index.
While there is a way to determine the number of rows, there is no simple way to iterate through the table rows to display all of the data. There may be ways to generate the table automatically but that is beyond the scope of this introduction.
The straight forward method is to fill in all the cells in a range of cells with all tokens for a larger number of rows than you anticipate that you will need.
To demonstrate, you can create a table that displays values for anchors. Open the Sample2 template for edit once more and insert 5 rows between rows 12 and 13.
Next, add values starting at cell B12 to form the table header with title that looks something like this.
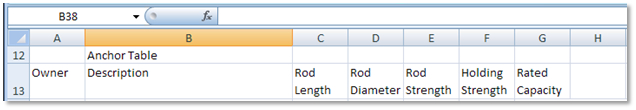
Note that the cells in row 13 have been formatted to allow word wrap.
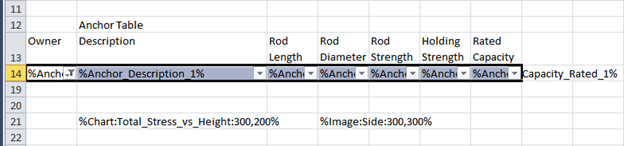
Next, starting at cell A14 and going across, add the tokens: %Anchor_Owner_1%, %Anchor_Description_1% , %Anchor_RodLengthAGL_1%, %Anchor_RodDiameter_1%, %Anchor_RodStrength_1%, %Anchor_HoldingStrength_1% , %Anchor_Capacity_Rated_1%.
Repeat this for the next row starting at A15 using the index _2 in place of _1 so that for the second row, the tokens will be: %Anchor_Owner_2%, %Anchor_Description_2% , %Anchor_RodLengthAGL_2%, %Anchor_RodDiameter_2%, %Anchor_RodStrength_2%, %Anchor_HoldingStrength_2% , %Anchor_Capacity_Rated_2%.
Do this again for rows 16, 17, 18 using index values _3, _4 and _5 respectively.
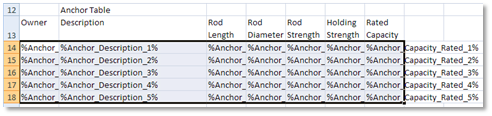
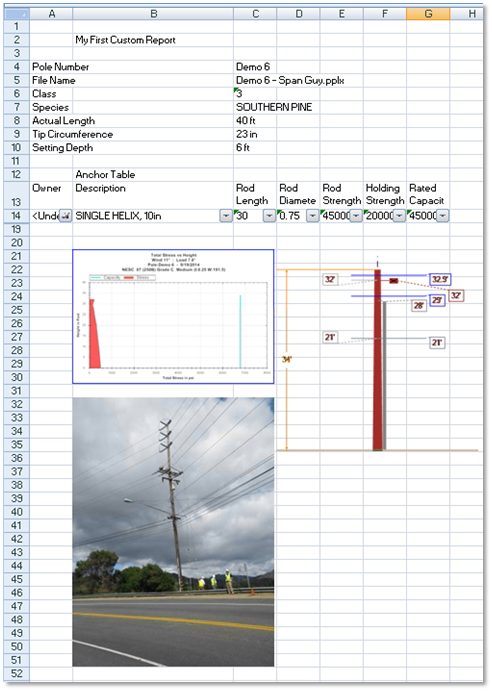
Sample 2 should now look like this:
In the figure, the token text is not visible due to the superposition of the content of the adjacent column.
Save the changes and Display again. The new “Demo 6 – Span Guy_Sample2.xlsx”report should look like this:
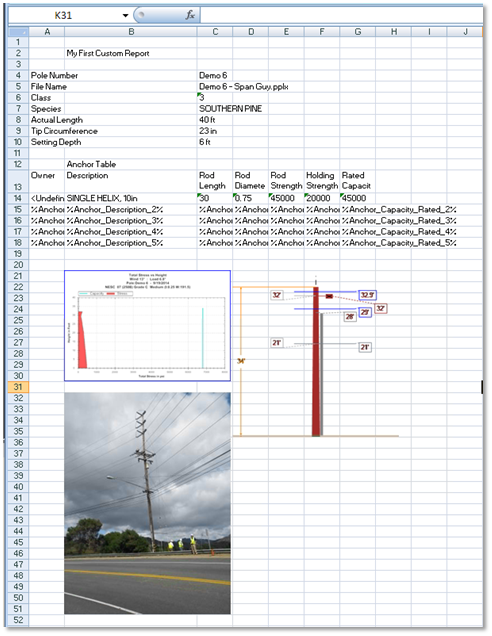
There is only one anchor in the demo pole so the first line of the table contains the values for that anchor. However, you notice that the remaining rows simply display the unexpanded tokens.
Hiding Unexpanded Tokens
With a bit of extra effort the template can be modified to display only table values that do not contain the value “%Anchor”.
For this demonstration, add an anchor to the pole so that there will be at least two.
In the Custom Reports tool, select Sample2, click the Edit command and make the following changes:
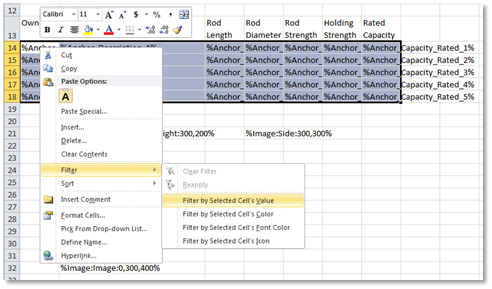
Select the range of cells A14 to G18.
Right click in cell A14, select Filter and then Filter by Selected Cell’s Value.
Save the changes and Display again. The new “Demo 6 – Span Guy_Sample2.xlsx”report should look like this:
The range of cells collapses and a filter control,  , appears on the A14 cell.
Left click on the filter control and select Text Filters►Does Not Contain… from the menu. 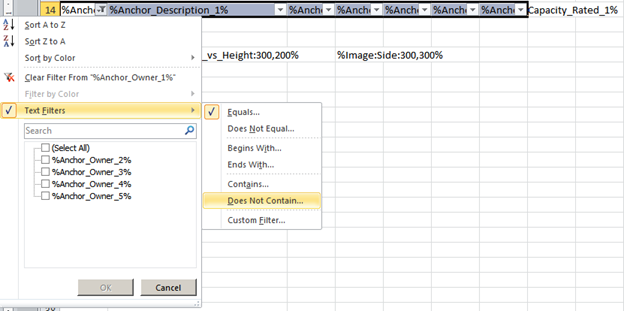
Enter “%Anchor*%” in the match string field and click OK.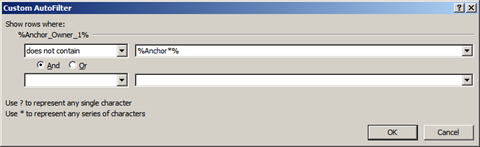
Any row in the range that does not contain an %Anchor token will be displayed.
Sample 2 should now look like this:
Save the changes and Display again. The new “Demo 6 – Span Guy_Sample2.xlsx”report should look like this:
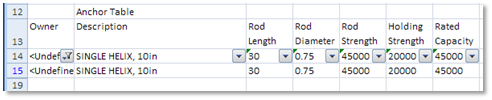
At this point you might say, “Why is it not displaying the other Anchor?”. To get it to display all the Anchor data you must reapply the filters on the filtered cells of the report worksheet.
Right click on the A14 cell and select Filter ► Reapply. The Anchor table will display all rows of the table that do not contain the text “%Anchor”. The result will look like this.
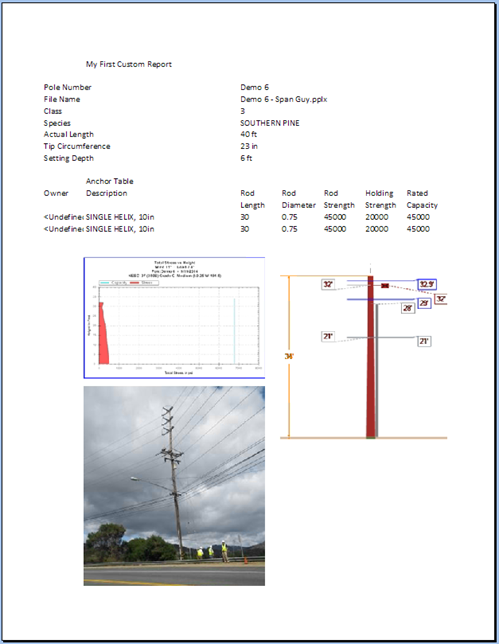
You can see how this will be appear when it is printed. Select Print Preview option. The finished report looks something like this.
In Conclusion
This document has touched on some of the elements that you can use to prepare simple reports using Excel worksheets and O-Calc Pro 5. It has provided a general treatment of the types of tokens and their use. Additional experimentation will be required to achieve a fuller understanding of specific token types.
Experienced Excel users should be able to create useful and well formatted reports using the Custom Report tool features.
Getting Help
Additional help may be available in O-Calc Pro user forums and online documentation. Log on to http://www.osmoseutilities.com/o-calcpro for support resources.
Appendix A
This is a sample output listing of tokens produced by the Custom Reports Other ► List Available Tokens command
——————————————————————————–
| Tokens
——————————————————————————–
%PPLX_FILE_NAME% Loaded PPLX file path
%USER_NAME% Environment.UserName
%WORKSTATION% Environment.MachineName
%ENTER_TEXT:% User entered text
%Units_Len_Large_Long% Units of length (Feet or Meters)
%Units_Len_Large_Abrev% Units of length Abreviated (ft or m)
%Units_Len_Small_Long% Units of length (Inches or Centimeters)
%Units_Len_Small_Abrev% Units of length Abreviated (in or cm)
%Units_Len_Tiny_Long% Units of length (Inches or Millimeters)
%Units_Len_Tiny_Abrev% Units of length Abreviated (in or mm)
%Units_Press_Large% Units or Pressure (psf or Pa)
%Units_Press_Small% Units of Pressure (psi ro kPa)
%Units_Load_Long% Units of Load (Pounds or Newtons)
%Units_Load_Abrev% Units of Load Abreviated (lbs or N)
%Units_Weight_Long% Units of Weight (Pounds or Kilograms)
%Units_Weight_Abrev% Units of Weight Abreviated (lbs or kg)
%Units_Moment_Long% Units of Moment (Foot-Pounds or Newton-Meters)
%Units_Moment_Abrev% Units of Moment Abreviated (ft-lb or N-m)
%Units_Vel_Long% Units of Velocity (Miles Per Hour or Kilometers Per Hour)
%Units_Vel_Abrev% Units of Velocity Abreviated (mph or kph)
%Units_Temp_Long% Units of Temperature (Fahrenheit or Celsius)
%Units_Temp_Abrev% Units of Temperature Abreviated (f or c)
%Units_Density_Large_Long% Units of Density (Pounds Per Cubic Foot or Kilograms Per Cubic Meter)
%Units_Density_Large_Abrev% Units of Density Abreviated (pcf or kgm3)
%Software_Version% Version number of O-Calc Pro
%Pole_ID% The pole number
%Pole_Latitude% Latitude
%Pole_Longitude% Longitude
%Pole_Elevation% Elevation
%Pole_Aux_Data_1% Free-form string field for customer data
%Pole_Aux_Data_1_Label% Label assigned by customer
%Pole_Aux_Data_2% Free-form string field for customer data
%Pole_Aux_Data_2_Label% Label assigned by customer
%Pole_Aux_Data_3% Free-form string field for customer data
%Pole_Aux_Data_3_Label% Label assigned by customer
%Pole_Aux_Data_4% Free-form string field for customer data
%Pole_Aux_Data_4_Label% Label assigned by customer
%Pole_Aux_Data_5% Free-form string field for customer data
%Pole_Aux_Data_5_Label% Label assigned by customer
%Pole_Aux_Data_6% Free-form string field for customer data
%Pole_Aux_Data_6_Label% Label assigned by customer
%Pole_Aux_Data_7% Free-form string field for customer data
%Pole_Aux_Data_7_Label% Label assigned by customer
%Pole_Aux_Data_8% Free-form string field for customer data
%Pole_Aux_Data_8_Label% Label assigned by customer
%Pole_Mfg_Length% pole’s manufactured length
%Pole_Actual_length% pole’s actual length
%Pole_Class% pole class designation
%Pole_Species% wood species or material
%Pole_SettingDepth% the setting depth
%Pole_Circum_Tip% circumference at tip
%Pole_Circum_GL_Applied% circum at groundline as burried in in either by spec or measured
%Pole_Circum_GL_Method% value is either “Calculated” or “Measured”
%Pole_Effective_GL_Circumference% The effective groundline circumferece if pole is damaged
%Pole_GL_Fiber_Stress% pole groundline fiber stress
%Pole_Fiber_MOR_At_GL% pole groundline fiber (MOR) stress PSI
%Pole_Material_Constant% Pole Material Constant
%Pole_Characteristic_Bending_Strength% pole characteristic bending strength PSI
%Pole_Characteristic_Shear_Strength% pole characteristic shear strength PSI
%Pole_Characteristic_Compression_Strength% pole characteristic compression strength PSI
%Pole_Effective_Length% pole effective length
%Pole_ANSI_FSR_Applied% Yes or No
%Pole_Allowable_Moment_GL% the pole’s allowable moment if applied
%Pole_Allowable_Stress_GL% psi or kPa rounded to 0 decimal places
%Pole_Allowable_Moment_At_MCU_Height% The allowable moment at MCU Height
%Pole_Code% NESC, GO 95, etc.
%Pole_NESC_Rule% the NESC rule applied
%Pole_Loading_District% Heavy, Medium, Light
%Pole_Construction_Grade% B, C, D
%Pole_Ice_Thickness% ice thickness
%Pole_Wind_Speed_Applied% wind speed
%Pole_Rule_250C_Max_Wind_Speed% Calculated max wind speed for the current load case
%Pole_Wind_Pressure% Horiz Wind Pressude psf
%Pole_Wind_Angle_Method% “Manual” or “Automatic”
%Pole_Deflection_Amount% deflection at tip in inches or centimeters
%Pole_Deflection_Angle% deflection angle at tip in degrees
%Pole_Structure_Type% The pole’s Structure Type value.
%Pole_New_Or_Existing% “New” or “Existing”
%Pole_Strength_Factor% The pole’s Strength Factor value.
%Pole_Guy_Strength_Factor% The pole’s Guy Strength Factor value.
%Pole_Anchor_Strength_Factor% The pole’s Anchor Strength Factor value.
%Pole_Transverse_Wind_Load_Factor% The pole’s Transverse Wind Load Factor value.
%Pole_Wire_Tension_Load_Factor% The pole’s Wire Tension Load Factor value.
%Pole_Modulus_Of_Elasticity% psi or kpa to the nearest whole number
%Pole_Vertical_Load_Factor% The pole’s Vertical Load Factor value.
%Pole_Factor_Of_Safety% The pole’s Factor Of Safety value.
%Pole_Bending_Factor_Of_Safety% The pole’s Bending Factor Of Safety value.
%Pole_Vertical_Factor_Of_Safety% The pole’s Vertical Factor Of Safety value.
%Pole_Installation_Or_Replacement% The pole’s Installation Or Replacement value.
%Pole_Density% The pole’s Density value.
%Pole_Ice_Density% The pole’s Ice Density value.
%Pole_Tilt% amount of pole lean if any direction
%ASNZS_Strength_Reduction_Factor% AS/NZS 7000 Strength Reduction Factor
%ASNZS_Stability_Factor% AS/NZS 7000 Stability Factor
%ASNZS_Load_Duration_Factor% AS/NZS 7000 Load Duration Factor
%ASNZS_Immaturity_Factor% AS/NZS 7000 Immaturity Factor
%ASNZS_Shaving_Factor% AS/NZS 7000 Shaving Factor
%ASNZS_Processing_Factor% AS/NZS 7000 Processing Factor
%ASNZS_Degradation_Factor% AS/NZS 7000 Degradation Factor
%ASNZS_Shear_Area_Mode% AS/NZS 7000 Shear Area Mode
%ASNZS_Combined_Bending_and_Compression% AS/NZS 7000 Combined Bending and Compression
%ASNZS_Combined_Shear_and_Torsion% AS/NZS 7000 Combined Shear and Torsion
%Sum_MCU% percent 0-100, 1 place after decimal
%Sum_GLCU% percent 0-100, 1 place after decimal
%Sum_Vertical_Buckling_CU% percent 0-100, 1 place after decimal
%Sum_MCU_Height% feet or meters, 1 place after decimal
%Sum_GLCU_Height% feet or meters, 1 place after decimal
%Sum_Vertical_Buckling_Constant% Summary Vertical Buckling Constant value.
%Sum_Vertical_Buckling_Column_Height% Summary Vertical Buckling Column Height value.
%Sum_Vertical_Buckling_Section_Pct_Column_Height% Summary Vertical Buckling Section Pct Column Height value.
%Sum_Vertical_Buckling_Section_Diameter% Summary Vertical Buckling Section Diameter value.
%Sum_Vertical_Buckling_Min_GL_Diameter% Summary Vertical Buckling Min GL Diameter value.
%Sum_Vertical_Buckling_Margin_Of_Safety% Summary Vertical Buckling Margin Of Safety value.
%Sum_MCU_Wind_Angle% Summary MCU Wind Angle value.
%Sum_GLCU_Wind_Angle% Summary GLCU Wind Angle value.
%Sum_Wind_Angle% Summary Wind Angle value.
%Sum_MCU_Load_Angle% Summary MCU Load Angle value.
%Sum_GLCU_Load_Angle% Summary GLCU Load Angle value.
%Sum_Reporting_Angle% reporting angle, determined by the deflection angle at the tip
%Sum_Reporting_Angle_Type% Summary Reporting Angle Type value.
%Sum_Vertical_Buckling_Wind_Angle% Summary Vertical Buckling Wind Angle value.
%Sum_Bending_Moment_GL% Summary Bending Moment GL value.
%Pole_Overturn_Moment% The pole’s Overturn Moment value.
%Sum_Bending_Moment_Max% Summary Bending Moment Max value.
%Sum_Vertical_Buckling_Load% lbs or newtons vertical load at buckling height
%Sum_Vertical_Buckling_Capacity% Summary Vertical Buckling Capacity value.
%Sum_Pole_Status% “Adequate”, “Near Capacity”, “Fail”
%Sum_Anchor_Status% Summary Anchor Status value.
%Sum_Guy_Status% Summary Guy Status value.
%Sum_Guy_Solved% Yes or No