With the release of O-Calc Pro version 6.0, also known as O-Calc Pro Line Design, a new report can be generated. This report analyzes an entire line of poles based on wind parameters that are set by the user. More information about generating this report can be found in the O-Calc Pro Line Design User Guide.
An example of this report is shown below, for a Line Design with 8 poles.
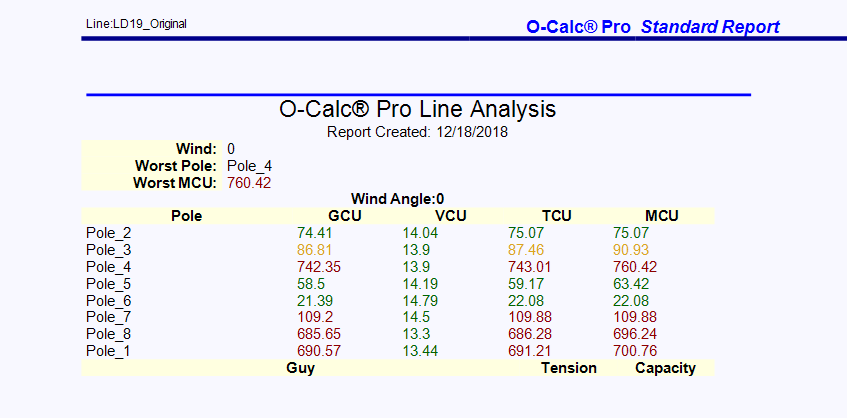
A number of things are provided in this report. The name of the Line Design file is provided in the upper left-hand corner, while the date the report was generated is provided under the O-Calc Pro Line Analysis title.
The first small section of the report indicates a wind angle, worst pole, and worst MCU. The Wind value refers to the wind angle being used for the calculation that generated the other results. For instance, based on this image, a wind angle of 0° would result in Pole_4 being the Worst Pole in this line design, with an overall MCU, or Maximum Capacity Utilization of 760.42%.
Following this section, a larger section addresses each pole in the line, indicating each pole’s Groundline Capacity Utilization, Vertical Capacity Utilization, Transverse Capacity Utilization and Maximum Capacity Utilization. For each pole listed, these values are provided as percentages. Additionally, these values are color coded based on pass/close to failure/fail basis. Values indicated in green are values that are considered passing. Values in yellow or orange are passing, but approaching failure, and values in red indicate failure, or exceeding 100%.
The image above shows only the values that would be found with a wind angle of 0°. Depending on how the report is generated, values can also be seen for many wind directions, like in the report shown below.
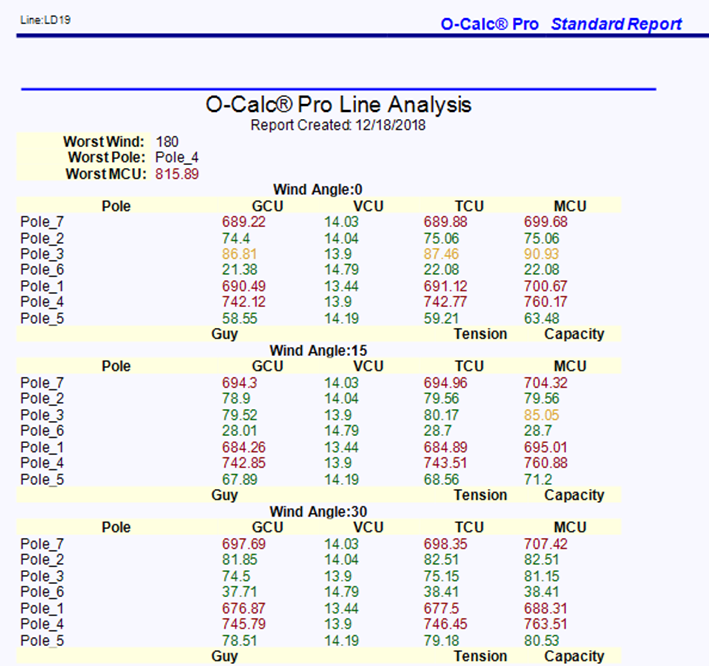
In cases where multiple wind directions are being analyzed, the small section at the start of the report will refer specifically to the Worst Wind direction.
The O-Calc Pro Line Analysis Report will also provide information on any Guying on the poles in a line, if present. For example, below is an image of the same report, run with guying on several of the poles.

Each guy wire present in the line design is shown, with an indication of which pole it is on in the parenthesis next to each guy wire. Additionally, the tension and capacity of each guy wire is shown. These values may change based on the wind angle being analyzed, so these guy wires are included under each wind angle section.
Recent Comments