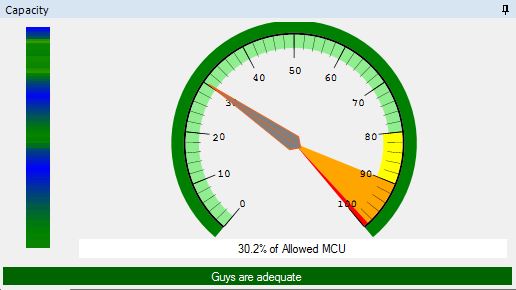
In O-Calc Pro, the capacity display window indicates how much of a pole’s capacity is being utilized by the spans, equipment, and other attachments on the structure. By default, the capacity meter remains in the green as long as the capacity being utilized is 80% or less. Then between 80-90%, the capacity meter is in yellow. From 90-100%, the meter is in orange. Lastly, any capacity utilization over 100% is indicated in red, as the pole is overloaded.
However, it is possible to customize this capacity display. If a user would like to adjust the capacity display, this can be done using the Capacity Threshold attributes. To do this, a user first needs to select the loadcase that is on the pole.
![]() With the loadcase selected, in the data entry window, change the filter to Threshold using the filter drop down list.
With the loadcase selected, in the data entry window, change the filter to Threshold using the filter drop down list.
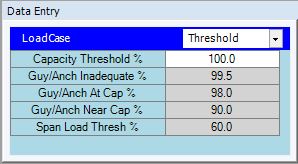
In this window, it is possible the change the threshold values for the capacity display.
For Example, changing the “Capacity Threshold %” value to 90, would cause the capacity display meter to show in red if the capacity exceeds 90%.
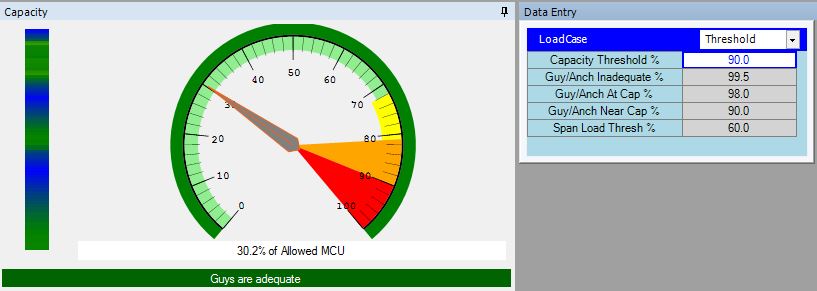
This will also force the orange and yellow zones to essentially move to lower percentages.