Analysis Report – Page 1
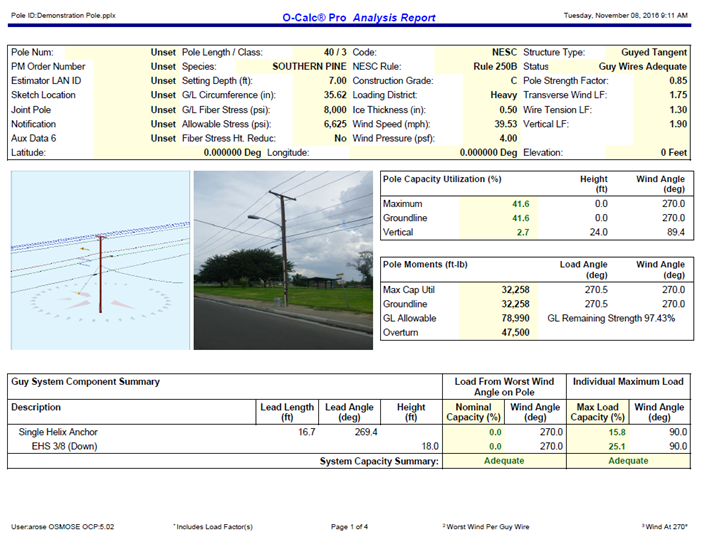 Figure 1. Page 1 of Analysis Report
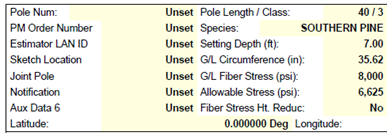
Pole Num – set by the user in the data entry panel
Aux Data Fields 1-6 – In this example, lines 2-7 on the left-hand side (PM Order Number – Aux Data 6) show where a user can enter custom fields. When a user chooses not to enter custom fields, these lines are left as is, like for Aux Data 6, where no user defined attribute has been entered. These are modified in the data entry window for the pole, under the filter “User Data”
Latitude/Longitude/Elevation – if the coordinates for the pole have been collected, they can be entered under the Edit>Pole Coordinates option, where they will appear here on the report. Elevation of the pole can also be entered
Pole Length/Class – Set when the pole is selected during modeling of the structure; found in the brand on a pole typically
Species – Set when the pole is selected during the modeling of the structure; found in the brand on a pole typically
Setting Depth (ft) – how far into the ground the base of the pole has been set. Defaults to a value based on the loadcase applied to a pole, but can be adjusted by the user. Can also be set by using the Digital Measurement Technology within the O-Calc “Measure” tab, if a photo of the pole has been taken with a Calibrated Visual Target
G/L Circumference (in) – the circumference of the pole at the ground line – set to a default value based on the setting depth and the height/class/species of the pole; possible to enter a value manually in the data entry window for the pole, under the “circumference” filter
G/L Fiber Stress (psi) – the capacity of the pole in terms of stress. Dependent on pole’s species, in particular the wood species fiber stress as specified by the ANSI 05.1 standard
Allowable Stress (psi) – the amount of stress that may be applied to the pole in accordance to the code specified in the assessment. The G/L Fiber Stress will be reduced based on the construction grade as specified by the safety code in use (such as NESC, GO 95, or CSA)
Fiber Stress Ht Reduc – percent reduction to the fiber stress with respect to the pole height. This value has been eliminated by most recent versions of code specifications
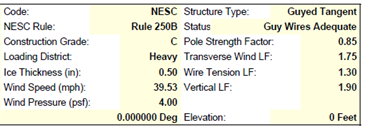
Code – Indicates what loadcase is being applied to the pole – Primarily will indicate whether the NESC or GO 95 type of loadcase is being applied; NESC or the National Electric Safety Code is applied for all states except California, which utilizes GO 95.
NESC Rule – Indicates what rule of the NESC standards is being applied to a pole. There are 3 listed in the master catalog of O-Calc Pro:
- Rule 250B Combined Ice and Wind
- Rule 250C Extreme Wind
- Rule 250 D Extreme Ice
Construction Grade – Indicates what construction guidelines must be considered when building the pole. For an NESC loadcase, construction grades are C, B, and CX
Loading District – Indicates the type of loading that must be applied to a pole; under the NESC guidelines, loading districts are Light, Medium, Heavy, or Warm Islands
Ice Thickness (in) – indicates the thickness of ice that is applied to the pole/spans on the pole – this is radial ice applied to the entire diameter of a span or component on the pole
Wind Speed (mph) – indicates the wind speed applied to the pole, set by the loadcase applied to the pole
Wind Pressure (psf) – the pressure applied to the pole and pole attachments as a function of the applied wind speed
determined by the loadcase applied to the pole
Structure Type – Can be set by the user in the data entry window for the pole, or can be left to Auto, wherein O-Calc determines the structure type based on span angles and the existence of guys on the pole
Status – indicates whether the guying system applied to a pole is adequate or inaccurate
Pole Strength and Load Factors – Lines 3-6 on the right-hand side of this pane show what the strength and load factors being applied to the pole are, as determined by the loadcase of the pole. Under the NESC, these two factors simultaneously are applied to a pole
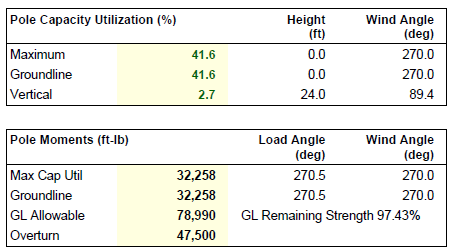
Figure 2. Pole Capacity Utilization and Pole Moments Tables
Pole Capacity Utilization (%) – Displays a percentage value indicating the utilized portion of the pole’s capacity. Indicates the height (ft) above ground line and the wind angle at which the capacity is being utilized.
- Maximum – the highest percent of utilization of the pole’s allowable stress; where the most capacity utilization is occurring on the pole
- Groundline – the percent of utilization of the pole’s allowable stress at the groundline what capacity is being utilized at the groundline
- Vertical – the percent of utilization of the pole’s allowable stress due to vertical load only
*Note: Maximum and Groundline capacity are not always the same value – different values indicate that the capacity being utilized at the groundline is not where the maximum capacity is being utilized. It is possible for Max Capacity Utilization to occur at a different location on the pole. This is indicated by different height and wind angle values.
Pole Moments (ft-lbs) – Displays the capacity being utilized in terms of ft-lbs rather than as a percentage. Shows the load angle on the pole as well as the worst-case wind angle.
- Max Cap Utilization – Shows the maximum number of ft-lbs of the total allowable moments are being used on the pole
- Groundline – Shows the number of moments on the pole that are being applied at the groundline. May be the same as the Max Cap Util if the maximum and groundline capacity utilization percentages are the same
- GL Allowable – shows the total allowable moments that can be applied to this pole; also indicates a groundline remaining strength value if there has been an applied groundline strength reduction. If there is no reduction, this area will remain blank
- Overturn – Shows a pole overturn value if the value has been set by the user
GL Remaining Strength – the estimated remaining strength percentage at the groundline of the pole due to section loss
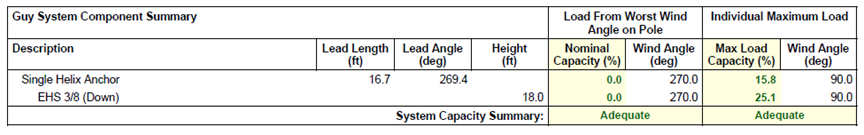
Figure 3. Guy System Component Table
This bottom portion of the report provide a summary of the guying system of a pole, if guying is used. If there is no guying, this section will be omitted from the report page. On this page is a description of each guying component on the pole, and an indication of whether the guying system is sufficient or not
Lead Length (ft) – indicates the lead length of the guy from a pole – set in the data entry window for the anchor or stub pole
Lead Angle (deg) – indicates the position of the guying component in terms of rotation around the structure – its position on the ground line compass; set in the data entry window for the anchor or stub pole
Height (ft) – indicates the attachment height of the guying component on the pole; set under the data entry window for the guy wire
Load From Worst Wind Angle on Pole – the load induced in the guy from the wind load is applied at the worse-case direction of the pole
Nominal Capacity (%) – represents the percent of guy capacity consumed when the wind is applied in the direction that causes the maximum stress to the pole
Wind Angle (deg) – indicates the wind angle being used in the calculation of the Nominal Capacity percentage – a different wind angle is used in the calculations for the Load from the worst wind angle and for individual maximum load
Individual Maximum Load – the load experienced by a guy at any wind angle independent of the other guys. This column represents the maximum applied load on a per-guy basis and does not consider the impossibility of wind being simultaneously applied to the structure from multiple vectors at the same time
Max Load Capacity (%) – Max load capacity represents the percent of guy capacity consumed by that guy at any wind angle
Analysis Report – Page 2
Page 2 of this report provides loading information divided in two ways; the top table displays loading information by the type of attachment and the bottom table displays the loading information by owner, if owner values have been assigned to components on the pole. Below is an elaboration on each of the fields listed in the tables.


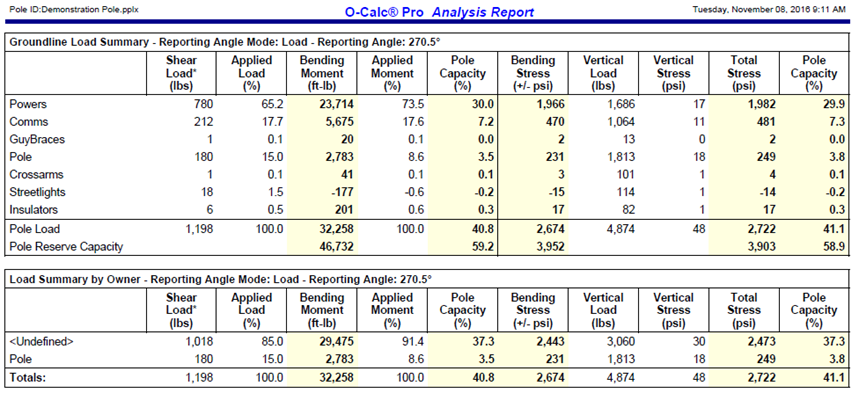
Figure 4. Groundline Load Summary Table and Load Summary by Owner Table
Shear Load (lbs) – load applied transverse to the longitudinal axis of the pole
Applied Load (%) – Indicates what portion of the load being applied to the pole is consumed by a component or a particular owner
Bending Moment (Ft-lbs) – indicates what bending moments are being applied by a component or by a particular owner
Applied Moment (%) – Of the total bending moments being applied, indicates the percentage that is being applied by a component or an owner
Pole Capacity (%) – Indicates what percentage of the pole’s bending capacity is being utilized by a component or by an owner
Bending Stress (+/- psi) – the amount of stress the bending moment induces on the pole
Vertical Load (lbs) – the amount of load applied along the poles longitudinal axis
Vertical Stress (psi) – the amount of stress the vertical load induces on the pole
Total Stress (psi) – the summation of the vertical and bending stress
Pole Capacity (%) Indicates what percentage of the pole’s total (bending stress and vertical stress) capacity is being utilized by a component or by an owner
There is additional summary information provided at the bottom of the Ground-line Load Summary:
Pole Reserve Capacity – for a given field, indicates how much remains available after subtracting what is being utilized by the pole. For instance, in the case of pole capacity this value indicates what percentage of the poles total capacity is left. In the case of bending moment, it indicates how many moments are not being utilized by attachments to the pole. In the case of bending stress, indicates how much bending stress the pole can withstand, that is not currently being applied to the pole.
Analysis Report – Page 3
While the Analysis Report is typically 4 pages, it can be longer depending on the number of components attached to a pole. Possibly starting on page 2 or 3 any additional pages provide a more detailed breakdown of components attached to the pole, divided into groups based on the type of attachment. Following these categorical breakdowns of attachments, there is a summary table on pole buckling.
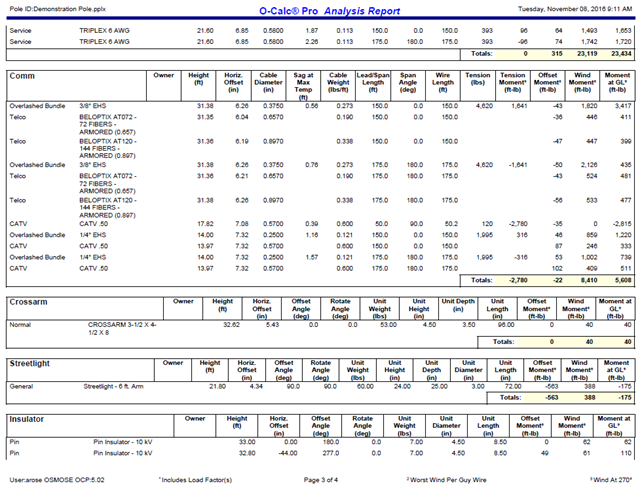
Figure 5. Breakdown of each Component on Pole and Pole Bucking Table
The attributes shown for each of these categorical tables depends on the component being looked at in greater detail. Below, is an explanation of each of these attributes broken down by category. Attributes that appear in multiple categories will only be explained once.
Power/Comm
| Detailed Load Components | |
| Owner | Set by the user to identify responsibility for a component – can be manually entered or left as <undefined> |
| height (ft) | Height of the component above GL |
| Horiz. Offset (in) | Adjustment in placemen to the left or right, entered as positive or negative values, in a horizontal plane |
| Cable Diameter (in) | Measured diameter of a wire |
| Sag at max temp (ft) | Amount of sag that occurs at the maximum temperature – derived from catenary curves |
| Cable Weight (lbs/ft) | Weight as specified by the manufacturer |
| Lead/span length (ft) | Distance that span extends; Set by the user |
| span angle (deg) | Angle span extends at relative to the GL compass |
| wire length (ft) | Actual length of the wire |
| Tension (lbs) | Amount of force being applied by a component |
| Tension Moment* (ft/lb) | The moment induced on the pole from the line tension |
| offset moment* (ft-lbs) | The moment induced on the pole from equipment with a horizontal offset |
| wind moment* (fb-lbs) | The moment induced on the pole from wind load |
| moment at GL* (ft-lbs) | The summation of moments at the groundline of the pole |
Crossarm/Streetlight/Insulator
| detailed load components | |
| Offset Angle (deg) | Rotation of a component relative to its parent item |
| Rotate Angle (deg) | Rotation of a component relative to the groundline compass |
| Unit Weight (lbs) | Individual weight of a component on the pole |
| Unit Height (in) | Individual height of a component on the pole |
| Unit depth (in) | Individual depth of a component on the pole |
| Unit Length (in) | Individual length of a component on the pole |
Guy Wire and Brace
| detailed load component | |
| attach height (ft) | Height above GL on the pole where a component is attached |
| end height (ft) | Height above GL of a component when it ends – if 0, end height is at the GL |
| wire diameter (in) | See above “cable diameter” |
| percent solid (%) | The percent of solid area within the cross-section of the cable |
| incline angle (deg) | Indicates the angle formed by the guy wire/brace and GL |
| Wire weight (lbs/ft) | See above “cable weight” |
| rest length (ft) | Length of the guy wire when at rest, with no tension |
| Stretch length (in) | Length of the guy once in tension |
Guy Wire and Brace (Loads and Reactions)
| detailed load component | |
| elastic modulus (psi) | Material property that defines the slope of the elastic stress-strain curve and material stiffness |
| rated tensile strength (lbs) | The tensile strength of the guy specified by the manufacturer |
| guy strength factor | The percent of rated tensile strength that may be applied to the guy |
| allowable tension (lbs) | The amount of tension the may be applied to the guy Indicates how much tension may be applied |
| initial tension (lbs) | The amount of tension applied to the guy during installation |
| loaded tension*2 (lbs) | The amount of tension on the guy at the worst wind direction for the guy and the appropriate code based guy load factors applied. |
| Maximum tension2 (lbs) | The amount of tension on the guy at the worst wind direction for the guy |
| applied tension3 (lbs) | The amount of tension on the guy at the worst wind direction for the structure |
| vertical load (lbs) | The vertical component of the guy tension on the pole |
| shear load in guy dir (lbs) | Load applied transversely to the longitudinal axis of the guy |
| shear load at report angle (lbs) | The vector component of shear load applied to the guy with respect to the report angle |
| moment at GL (ft-lbs) | The moment at the guy GL |
Anchor/Rod Load Summary
| detailed load component | |
| rod length AGL (in) | Length of the rod from the groundline |
| Strength of Assembly (lbs) | The total capacity of the rod |
| Anchor/rod strength factor | The percent of total rod capacity that may be applied |
| allowable load (lbs) | The amount of load that may be applied to the rod |
| max load (lbs) | The maximum load of the guy as the sum of the maximum tensions of all guys (at worst wind angles for each guy) attached to the anchor |
| load at pole mCU (lbs) | The load on the anchor at due to the structure’s worst load wind angle |
| max required capacity (%) | The capacity utilization of the anchor as a percentage. The ratio of the Max Load to the Allowable Load |
Pole Buckling
| detailed load componet | |
| buckling constant | Factor used to determine the effective length of the pole |
| buckling column height
(% buckling col. hgt.) |
The height at which the pole buckles |
| buckling section diameter (in) | Diameter of the pole where buckling occurs |
| Minimum buckling diameter at gl (in) | |
| diameter at tip (in) | Indicates the diameter of the pole at the tip – set based on height/class/species |
| Diameter at GL (in) | Indicates the diameter of the pole at the GL – set based on height/class/species and any inputs from the user, like a measured GL circumference |
| modulus of ELASTICITY (psi) | Material property that defines the slope of the elastic stress-strain curve and material stiffness |
| pole density (pcf) | Self-weight of the pole per cubic foot |
| ice density (pcf) | weight of ice per cubic foot |
| pole tip height (ft) | Indicates the height of the tip of the pole above GL – takes the set depth of the pole into account |
| buckling load capacity at height (lbs) | Capacity of the pole at the buckling column height |
| buckling load applied at height (lbs) | Load applied to the pole at the buckling column height |
| Buckling load factor of safety | Ratio of the buckling load applied to capacity at the buckling column height |
Analysis Summary
The Analysis Summary report is essentially page one of the Analysis report – it does not provide as much information or detailed breakdowns of loading by component or owner. Useful for providing a simplified sheet displaying the capacity utilization and some details about the pole being modeled.
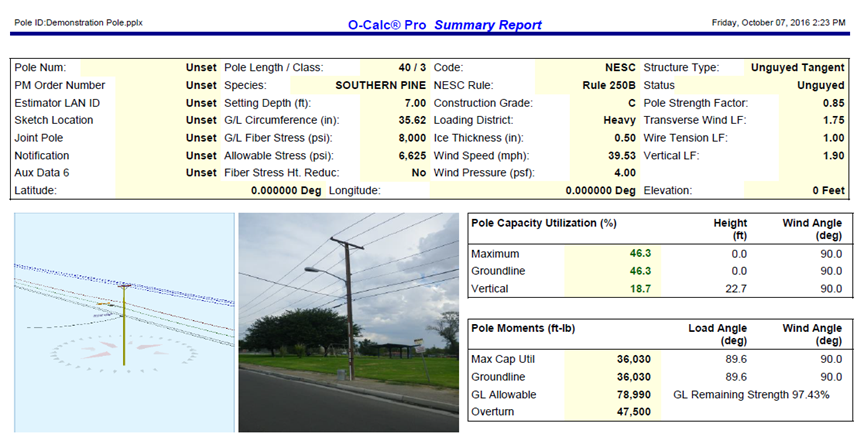
Figure 6. Analysis Summary Report
GO 95 Analysis Report
The GO 95 Analysis report is the same as the Analysis report, but it is specific to load cases that are part of the GO 95. Below the difference between these two reports are specified.
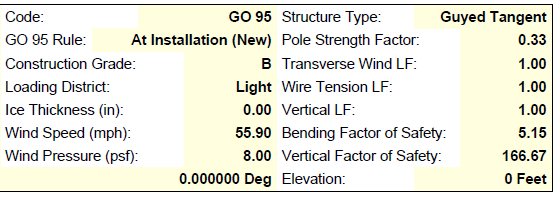
Code – this is set to display “GO 95” in this report
GO 95 Rule – will indicate whether the loadcase being applied is for a pole at replacement or at installation
Construction Grade – under the GO 95, construction grades are A, B, and C
Loading district – Under the GO 95, loading districts are either heavy for elevations above 3000 feet, or light for elevations lower than 3000 feet.
** Below structure type, the “status” attribute listed on the Analysis report is omitted, and the report highlights the safety factors being applied to the pole on lines 2-5 instead of 3-6
Bending Factor of Safety – The ratio of the total applied bending load to the allowable bending capacity of the pole
Vertical Factor of Safety – the ratio of the total applied vertical load to the allowable vertical capacity of the pole
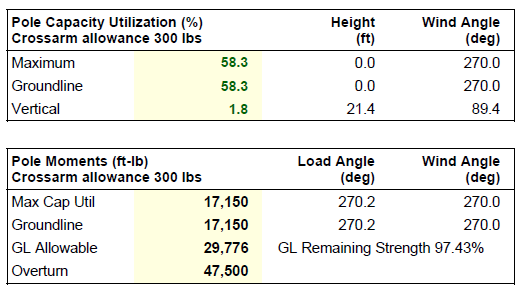
In the GO 95 Pole Capacity Utilization and Pole Moments tables, there is a line of text added that says “Crossarm allowance 300 lbs.” to reflect updates to the GO 95. This allowance is factored into the calculations reflected in these tables.
GO 95 Analysis Summary
This summary page is like the Analysis Summary; it gives a simplified, one page explanation of the loading on a structure, with the differences previously noted between this report and the Analysis Summary.