An essential aspect of performing pole loading in O-Calc Pro is ensuring that the finished product is correct – this process is often referred to as QA/QC, or Quality Assurance and Quality Control. The aim of this article is to address common items that should be checked when performing QA/QC Assessments. While this is not a full list, it provides a good overview of common errors that can be easily corrected.
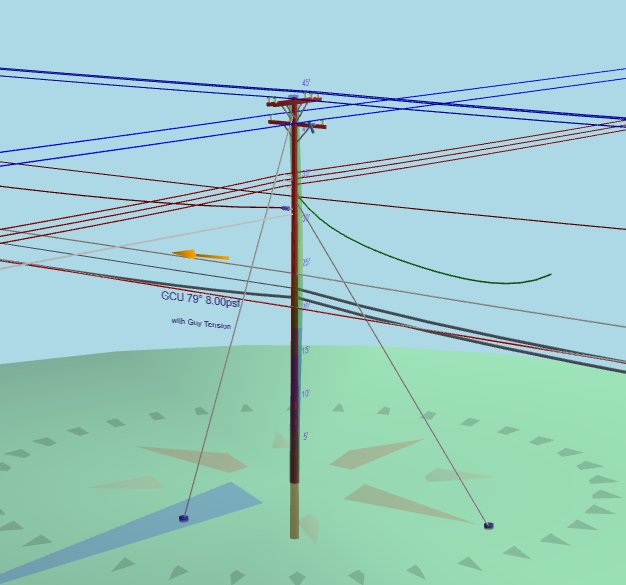
Below is an image of a pole that will be assessed in this article.
Comparing to Images and Google Earth
Complex poles such as this require a greater amount of attention to detail, as there are more opportunities for mistakes to be overlooked. First and foremost, a picture of the pole being assessed is vital to the QA/QC Process. A visual comparison can be made to ensure the correct number and type of attachments are present.
Another way to perform a visual comparison is to check the pole against what is shown in google earth. To do this, the “ShowPoleOnGoogleEarth” plugin and “ClipboardCaptureGPS” plugin must be enabled under the Options > Manage Plugins list. Additionally, GPS coordinates for the pole must be entered under Edit > Pole Coordinates. Once this is done, the pole can be shown in Google Earth by going to the File > Show on Google Earth > options; either render structure or show marker will open Google Earth at the pole’s location.
Once found, a visual comparison of the pole model can be done if another image is not available. The clipboard capture plugin can also be used to get updated pole coordinates, coordinates of the ends of a span (or the next pole) which can be used to get accurate span lengths/angles.
Checking a Loadcase
The loadcase included in a pole model determines the ice and wind loading, as well as additional parameters that affect the overall Maximum Capacity Utilization of a pole. For instance, the MCU readout for the pole pictured above is around 39%.
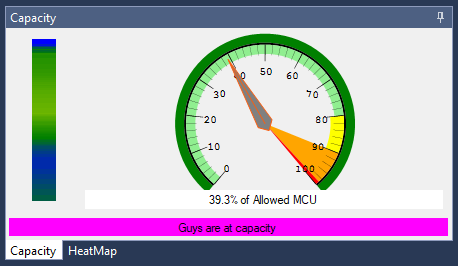
While this is not a failing pole, ensuring that the loadcase is correct can make a significant difference on what the MCU percentage is. This particular pole is utilizing a GO 95 Light Grade A at Replacement loadcase. While the specifics of various loadcases are not addressed in this article, let us assume that this pole is actually located in a Heavy loading area, and correct it’s loadcase.
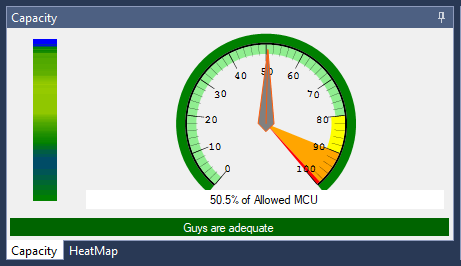
When the loadcase is changed, this pole has an increase in MCU of about 11%. While this pole is still passing, it is easy to imagine a scenario in which a loadcase change could be the difference between passing or failing. For this reason, ensuring that the correct loadcase was used in a pole model is an essential part of QA/QC.
Span Tension Values
Another common cause for errors in a pole model is an error in the tension being applied to a span. For more information about span types, please reference the wiki article specifically about the different tension modes in O-Calc Pro.
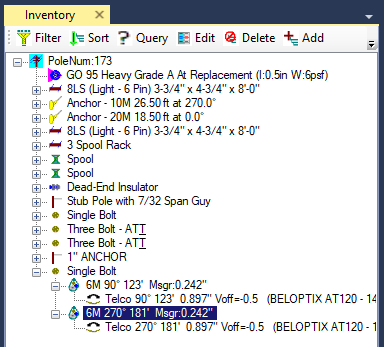
So, how do you know you have a tension issue? Any span that is marked in red in the inventory list, as pictured below, could have a tension value that is considered too high, which would result in the span failing. The pole does not have to be failing, to have spans that are failing. In our example, the pole is passing, but some of the spans are failing.
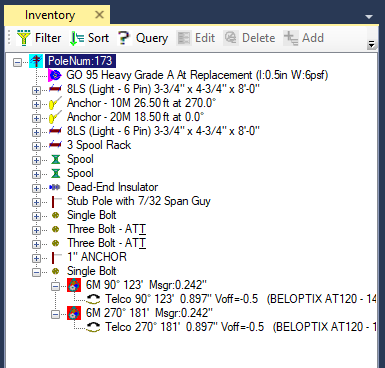
In this model, the two 6M messenger wires are considered failing. Upon closer inspection, we can see that the tension on these messenger wires is set to 60% of the messenger’s total rated strength; this is the maximum amount of tension that can be applied to a span.
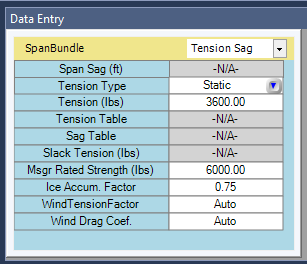
But how is this tension value determined? For all spans, the default tension mode is static tension. Additionally, the default percentage of rated strength that gets applied as tension, is 60%. Typically, a change would be made to this setting when the program is first installed, to prevent spans being set to the maximum amount of tension they can have. These changes would be made under the Options > Misc Options > Percent of Span Rated Strength to Apply as Tension tool. Below are the default values the program uses.
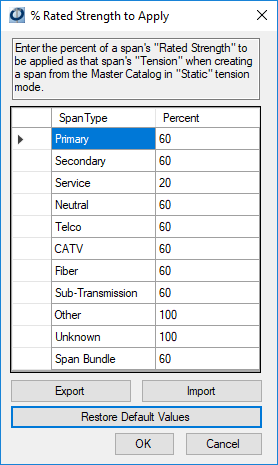
These values can be changed to something more realistic. While we do not provide values to use, they can be gauged based on initial stringing tension values provided by an area’s electric utility. What this window indicates is that for each span type, a percentage is shown for that span’s rated strength that will be applied as tension. For our messenger wire in the example pole, that falls under the “Span Bundle” category. Here it indicates that 60% is being used. This correlates with the 3600 lbs. of tension being applied, since that value is 60% of 6000 lbs., the messenger’s total rated strength.
To address the failing spans, this value can be changed to something else. If we are still being conservative, we could go with 40%. Once this value is entered, and the “ok” button is clicked, you may notice nothing changes in the inventory list. Each span that is failing must be substituted with the same type, from the Master Catalog, to get the tension recalculated with the new value. Once this is done, our new tension values are shown below.
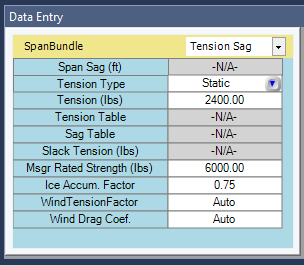
These spans are no longer marked in red in the inventory list.
Missing Equipment
Another common discovery is that equipment on the pole was not captured in the field notes, and therefor was not included in the O-Calc Model. While Equipment may not seem important to capture, all attachments on the pole should be captured for the most accurate pole loading analysis.
A comparison to Images or Google Earth should be made to see if equipment is missing from field notes. If so, model the equipment using either premade assemblies from the Master Catalog, or create the equipment using Generic Equipment.